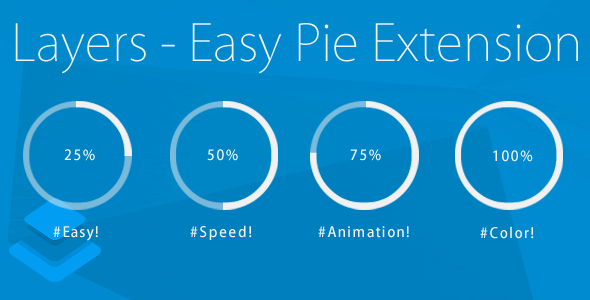
Easy pie chart is a jQuery plugin that uses the canvas element to render simple pie charts for single values. These charts are highly customizable, very easy to implement, scale to the resolution of the display of the client to provide sharp charts even on retina displays, and use requestAnimationFrame for smooth animations on modern devices Extension for Layers.

Features:
- Set Custom Chart Title
- Set Custom Short Excerpt
- Set Custom Chart Text
- Set Custom Percent
- Set Custom Bar Color
- Set Custom Chart Size
- Set Custom Line Width
- Set Custom Link
- Set Custom Animation Speed
- Start Animation On Visible in Viewport
- Set Custom Featured Image
- Set Custom Background Image & Color
Credits:
Easy Pie Chert by Robert Fleischmann.
Viewport Checker by Dirk Groenen.
Change log:
2015.5.12 – version 1.0 * First Release.

