Tag: visualization

  • Infographics and Checklist Builder – iList Professional (Media)

    Infographics and Checklist Builder – iList Professional (Media)

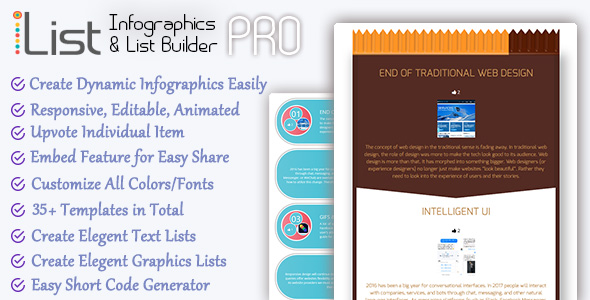
    Infographics and List Builder Plugin – iList Pro

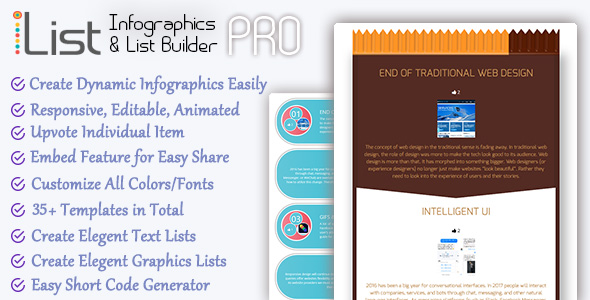
    iList is first of its kind WordPress plugin to build and create Infographics and elegant Lists effortlessly. Create Dynamic, HTML & Responsive Infographics or stylish Text or Graphics Lists easily and display on any WordPress page or post with short codes.

    This is a new way to create Infographics and upgrade your boring lists into exciting contents. It is a content creation tool that can help with your SEO. Turn your website into an Authority by creating exciting contents that your website users will love, bookmark, embed and share!

    What Can You Do with iList?

    Create beautiful, elegant Infographics, Text Lists or Graphics Lists easily by simply adding your own text and images and then selecting a template of your choice. Then show the iList on any page of your website anywhere.

    • The Infographics or Lists are all dynamic and HTML – so they are fully SEO friendly.
    • They are also Responsive – so readable in any screen size.
    • They are embeddable – so anyone else can share them on their websites
    • People can vote for each individual Infographics or List items – so your users can interact with them
    • They are customizable for every aspect of colors and fonts
    • iList Benefits:

      Creating useful and great looking Infographics can often take a lot of time and money (if you are not a designer yourself). This innovative and powerful, yet simple Infographics and List builder WordPress PlugIn allows you to create great looking Infographics and Elegant, Animated Lists without almost zero design expertise.

      The Embed iList feature allows other website owners to show Infographics you created on their websites and increases sharing, engagement and value of your own. As a HUGE bonus you can get Backlinks when your Infographics or Lists are shared!

      iList Features

      • Create Dynamic Infographics Easily
      • Responsive, Editable, Animated
      • Upvote Individual List Item
      • Customize All Colors/Fonts
      • Use predefined fonts or choose from 800+ google Fonts
      • 35+ Templates in Total
      • Create Elegent Text Lists
      • Create Elegent Graphics Lists
      • Easy Short Code Generator
      • Powerful short code options for extensive control over display
      • RTL support
      • Custom CSS to add your own style
      • Embed option. Other website owners can now embed the useful Infographics and lists you create on their websites with a backlink to your own website. Great for SEO!

      iList comes packed with 35+ fully responsive and innovative design templates. We are working on more beautiful templates that will be released in regular interval. If you are a blogger, webmaster, seo specialist or marketer this is an indispensable plugin for you!

      Live Use Case Examples:

      Infographic Chocolate Style 01
      Infographic Chocolate Style 02

      Infographic Origami Style 04

      Origami Style 06


      View All 35+ iList Demos

      Why iList?

      • Developed by a company with 14+ years of experience. You can rely on us
      • Always up to date and under active development for new features
      • Extended documentation
      • Easy and Flawless Setup
      • Fully Responsive Templates
      • Automatic updates – Update Easily using the Envato Toolkit
      • Powerful iList Options panel
      • Unique Features
      • Quick, Reliable, No-nonsense and Friendly One-on-One Support

      Version History

      Version 1.0 – released on Jan – 2017
      • Inception
  • Liquid Fill Gauge (Interface Components)

    Liquid Fill Gauge (Interface Components)

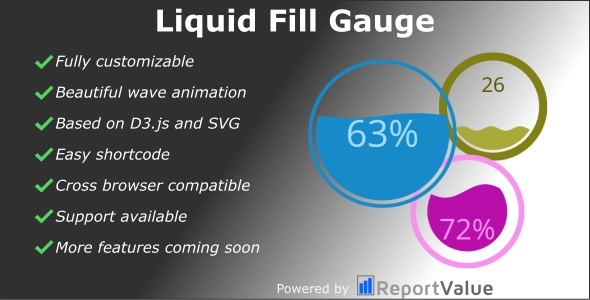
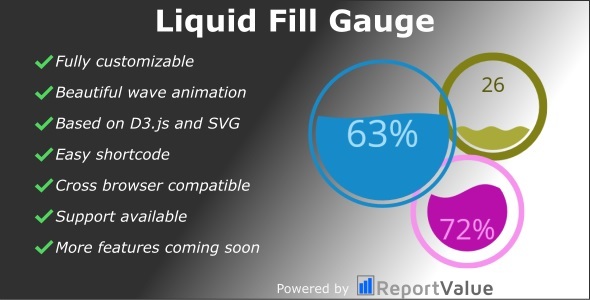
    This is a gauge plugin for WordPress, to create beautifully animated gauges or progress bars with a circular design. A set of 23 shortcode attributes are available to customize the gauge. Every gauge is rendered as a seperate SVG element and you can insert multiple gauges on the same page.

    These are the available shortcode attributes to customize a gauge (default values between brackets):

    • value (50): The current value of the gauge.
    • width (200px): The width of the gauge.
    • height (200px): The height of the gauge.
    • minvalue (0): The gauge minimum value.
    • maxvalue (100): The gauge maximum value.
    • circlethickness (0.05): The outer circle thickness as a percentage of it’s radius.
    • circlefillgap (0.05): The size of the gap between the outer circle and wave circle as a percentage of the outer circles radius.
    • circlecolor (#178BCA): The color of the outer circle.
    • waveheight (0.05): The wave height as a percentage of the radius of the wave circle.
    • wavecount (1): The number of full waves per width of the wave circle.
    • waverisetime (1000): The amount of time in milliseconds for the wave to rise from 0 to it’s final height.
    • waveanimatetime (1000): The amount of time in milliseconds for a full wave to enter the wave circle.
    • waverise (true): Control if the wave should rise from 0 to it’s full height, or start at it’s full height.
    • waveheightscaling (true): Controls wave size scaling at low and high fill percentages. When true, wave height reaches it’s maximum at 50% fill, and minimum at 0% and 100% fill. This helps to prevent the wave from making the wave circle from appear totally full or empty when near it’s minimum or maximum fill.
    • waveanimate (true): Controls if the wave scrolls or is static.
    • wavecolor (#178BCA): The color of the fill wave.
    • waveoffset (0): The amount to initially offset the wave. 0 = no offset. 1 = offset of one full wave.
    • textvertposition (0.5): The height at which to display the percentage text withing the wave circle. 0 = bottom, 1 = top.
    • textsize (1): The relative height of the text to display in the wave circle. 1 = 50%
    • valuecountup (true): If true, the displayed value counts up from 0 to it’s final value upon loading. If false, the final value is displayed.
    • displaypercent (true): If true, a % symbol is displayed after the value.
    • textcolor (#045681): The color of the value text when the wave does not overlap it.
    • wavetextcolor (#A4DBf8): The color of the value text when the wave overlaps it.

    Here is a fully functional shortcode with all available attributes:

    [liquidgauge value=”53” width=”200px” height=”200px” minvalue=”0” maxvalue=”100” circlethickness=”0.05” circlefillgap=”0.05” circlecolor=”#178BCA” waveheight=”0.05” wavecount=”1” waverisetime=”1000” waveanimatetime=”1000” waverise=”true” waveheightscaling=”true” waveanimate=”true” wavecolor=”#178BCA” waveoffset=”0” textvertposition=”0.5” textsize=”1” valuecountup=”true” displaypercent=”true” textcolor=”#045681” wavetextcolor=”#A4DBf8”]