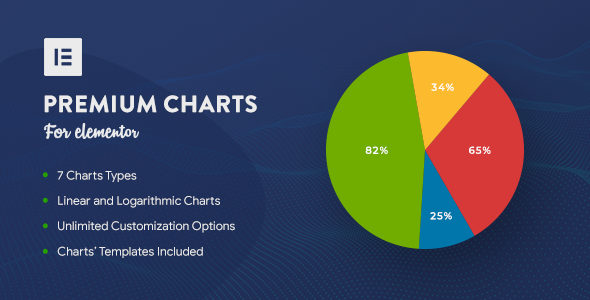
Add-ons July 11, 2018alexNo Comments Premium Charts for Elementor (Add-ons) Live PreviewPurchase 16.00 Read More
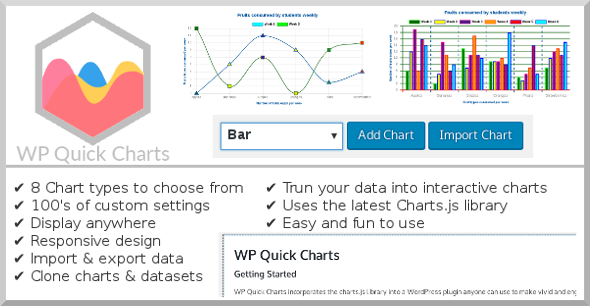
Utilities July 7, 2017July 7, 2017alexNo Comments WordPress Fast CHarts (Utilities) Live PreviewPurchase 22.00 Read More
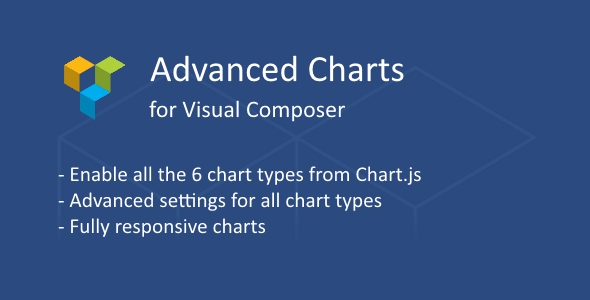
Add-ons January 3, 2017January 3, 2017alexNo Comments Evolved Charts Add-on for Visible Composer (Add-ons) Live PreviewPurchase 15.00 Read More
Add-ons July 17, 2015alexNo Comments Chart Components for Visible Composer (Add-ons) Live PreviewPurchase 14.00 Read More